
Service delivery & complaints
LupinServe
Better services. Better experiences.
LupinServe connects the person reporting a problem to the team that fixes it. Every complaint carries its location, category, SLA and history from the moment it is logged.
Leadership sees where service delivery is failing by ward and category, rather than waiting for the complaint to reach the news.
Modules
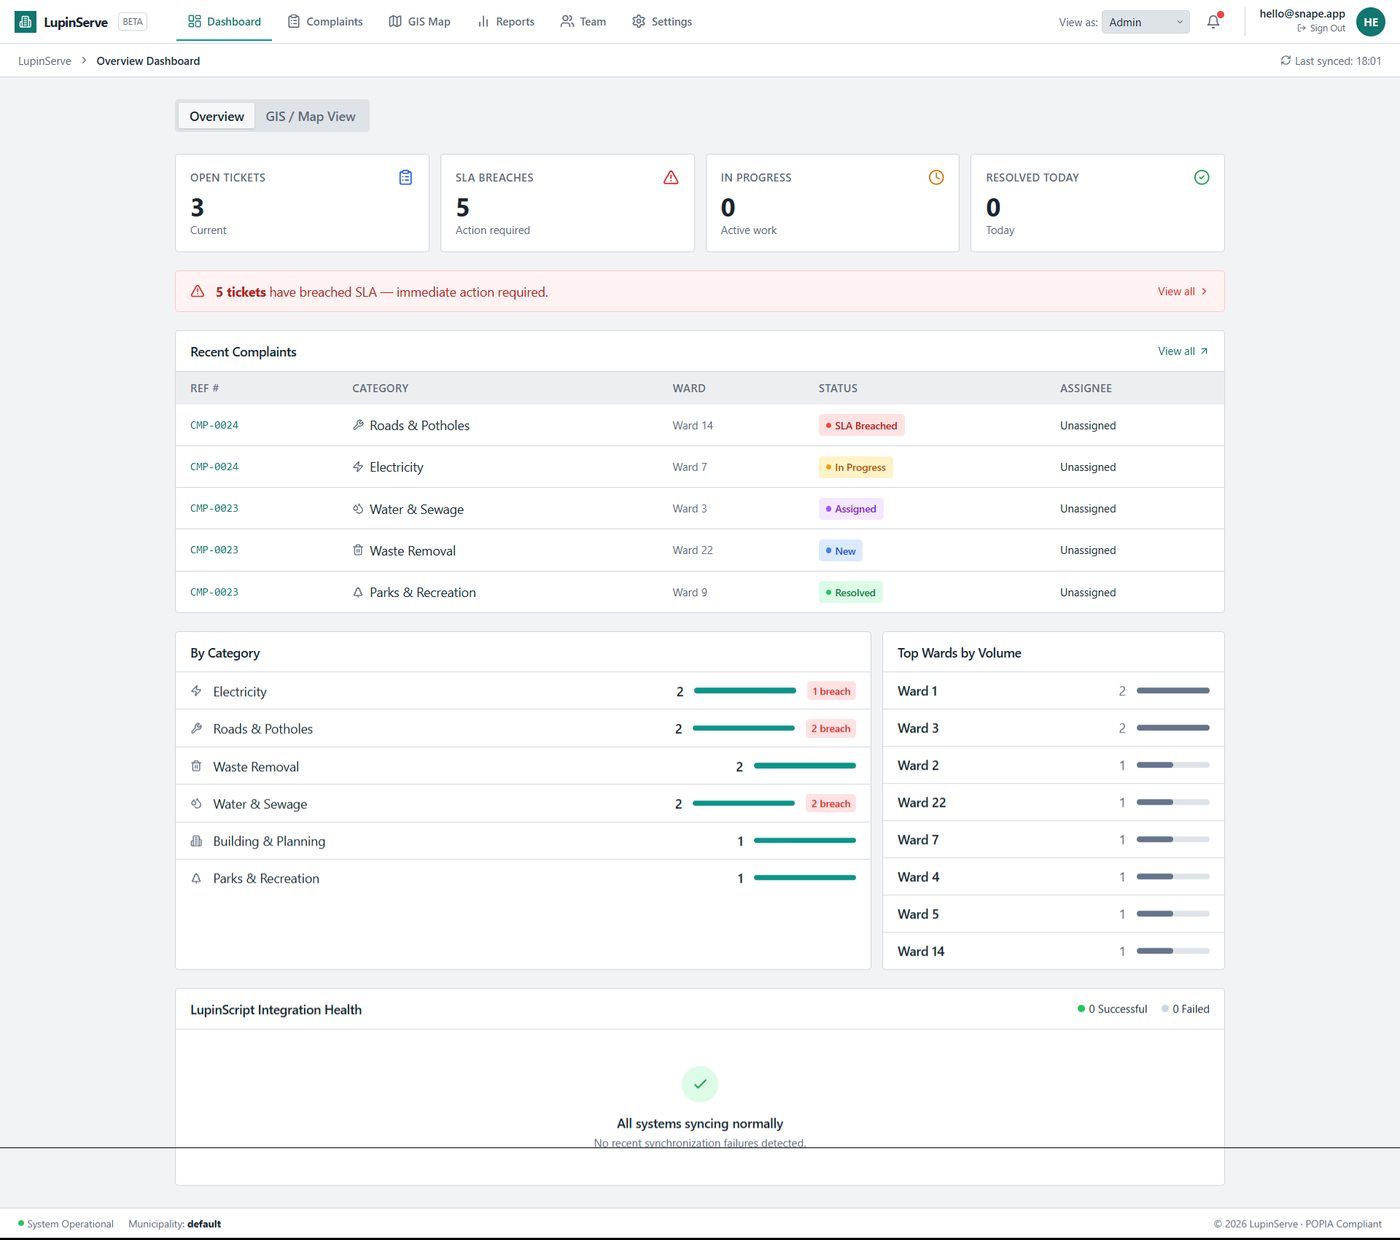
From report to resolution, in one thread.
Intake, triage, action and reporting share the same case record — no re-capture between channels.
Citizen reporting
A public channel for logging issues with location, category and evidence.
Complaint queue
One queue with source, ward, priority, SLA state and assignment.
Action console
Status updates, internal notes and public replies against each case.
GIS mapping
Cases plotted by ward and category so patterns are visible, not anecdotal.
SLA management
Due dates, breach flags and escalation applied consistently.
Analytics
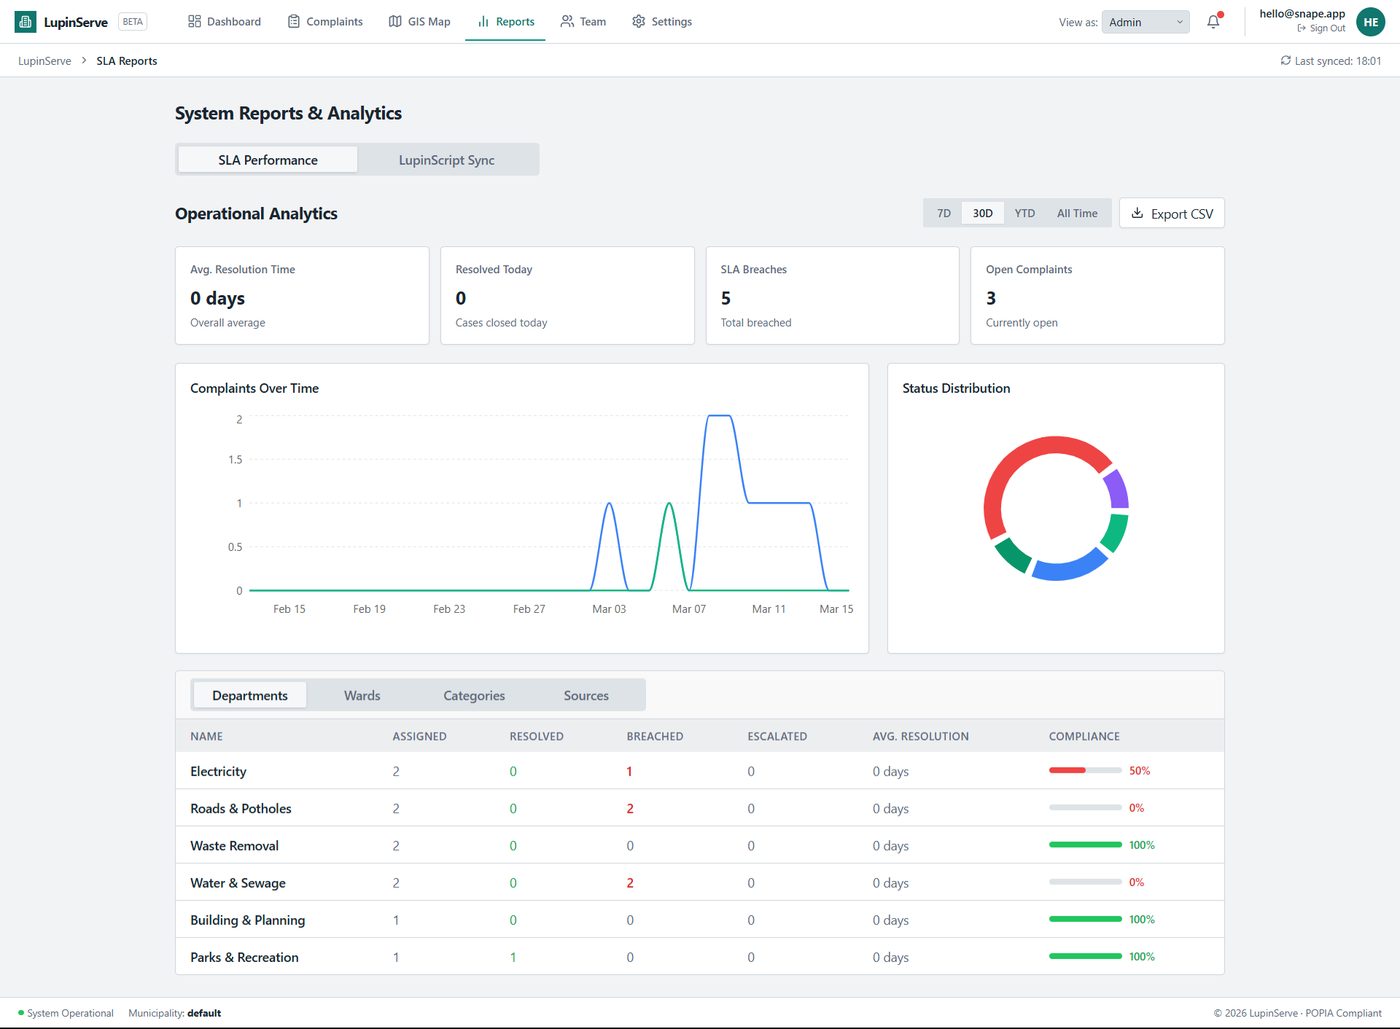
Resolution times, status distribution and departmental performance.
Intake
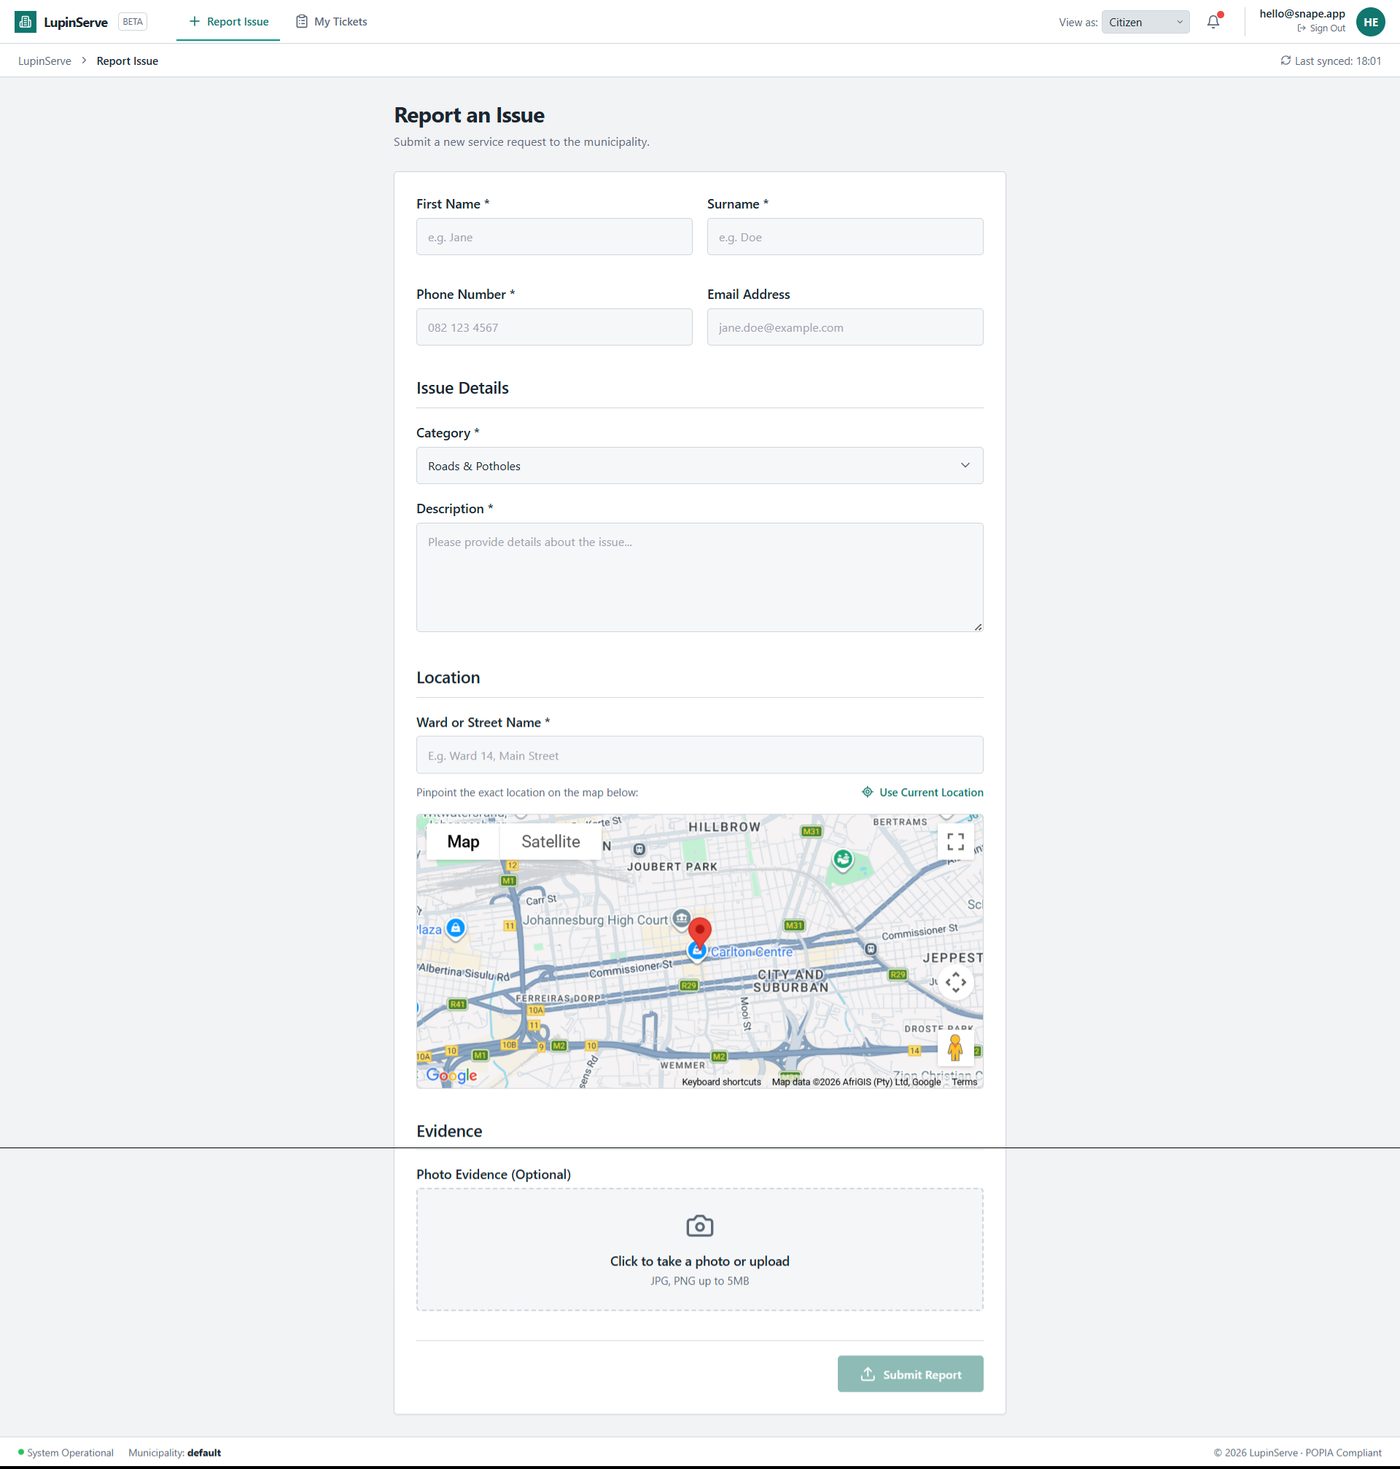
Residents report once, with location attached
A structured public form captures the issue, the exact location on a map and photographic evidence, so field teams arrive knowing what they are dealing with.
- Category, ward and description captured at source
- Pin-drop location and photo evidence attached to the case
- Reference number issued for follow-up
Triage
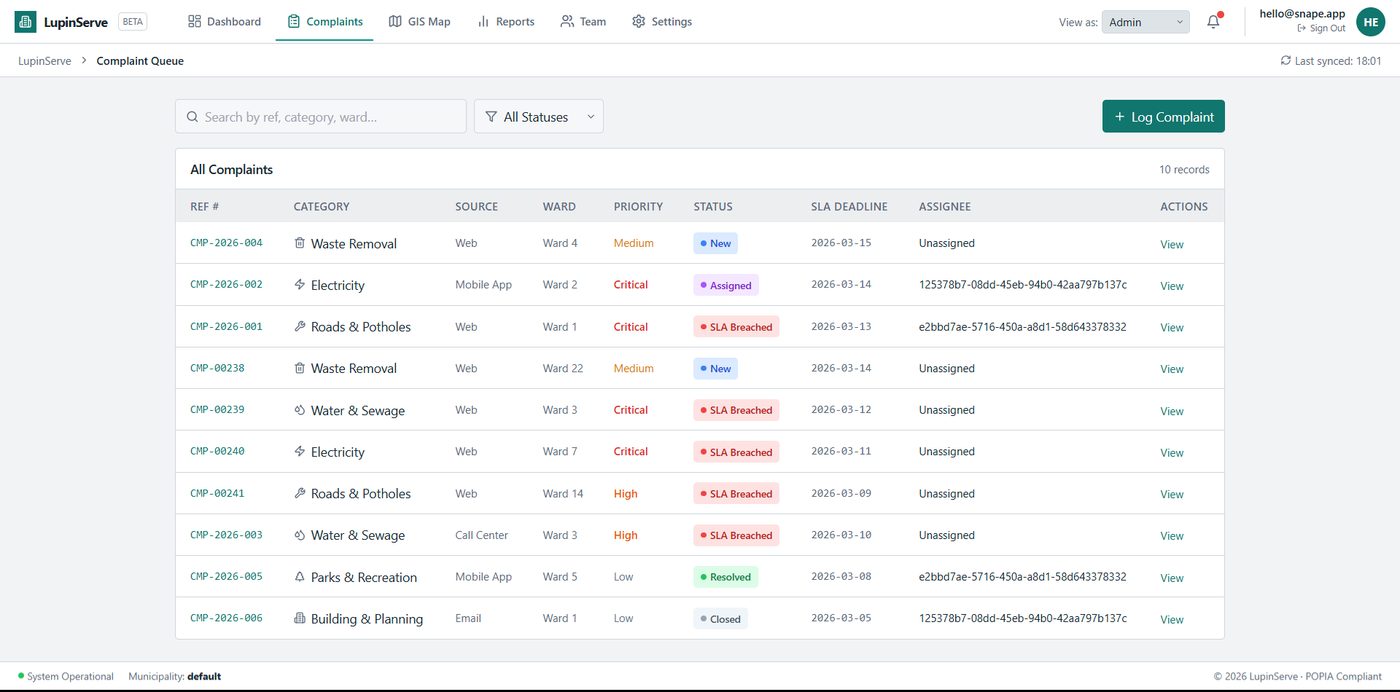
A queue that shows what is breaching
Every complaint sits in one queue with its source, ward, priority, SLA deadline and assignee — so escalation is based on the record, not on who shouted loudest.
- Filter by category, ward, status and priority
- SLA due dates with breach and escalation flags
- Action console for status updates, internal notes and public replies
Geography
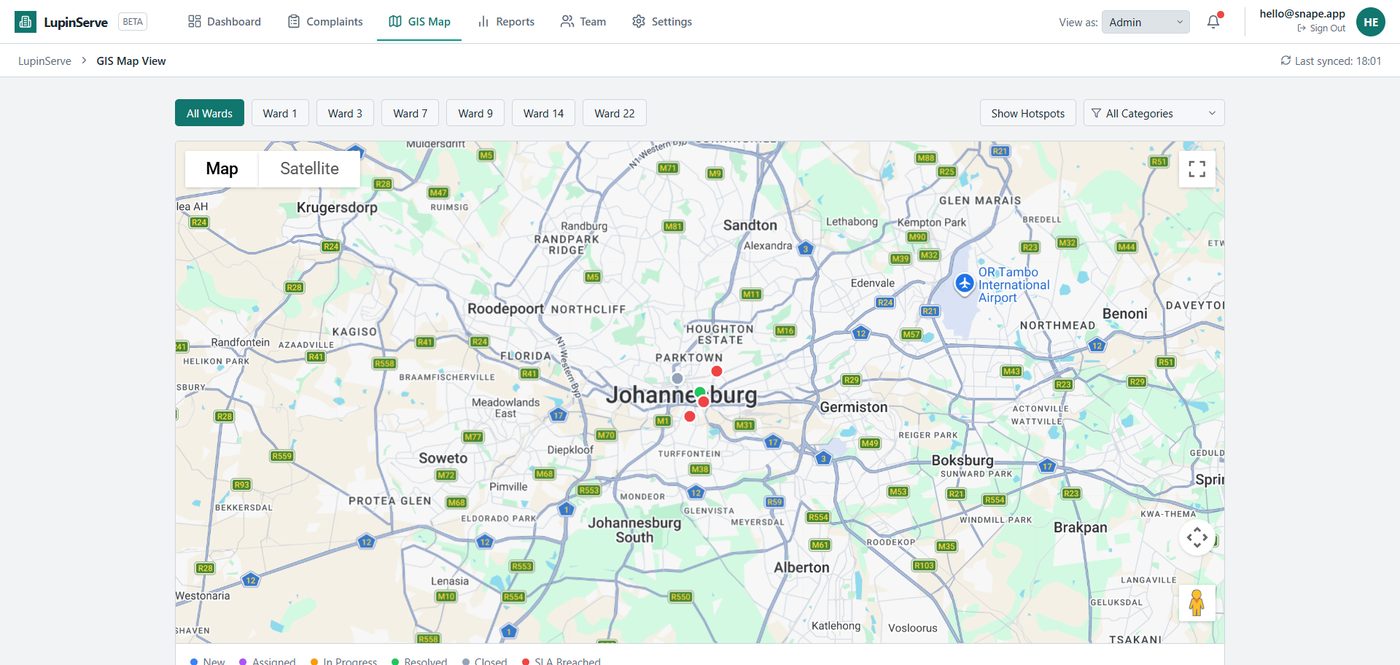
See service delivery by ward
Cases plotted geographically turn a list of complaints into an operational picture: which wards are under pressure, and which categories drive the volume.
- Ward and category filters over a live case map
- Hotspot visibility for planning and deployment
- Evidence for budget and maintenance prioritisation
Also inside
Reporting leadership can act on
Operational analytics per department, category and ward, produced from the cases themselves.
Who it is for
For everyone in the service delivery chain.
- Municipal call centres
- Ward councillors
- Roads, water and waste teams
- Customer care
- Operations management
- Residents
Close the loop on service delivery.
We look at your current complaint channels and SLA commitments, then show how LupinServe would track them.